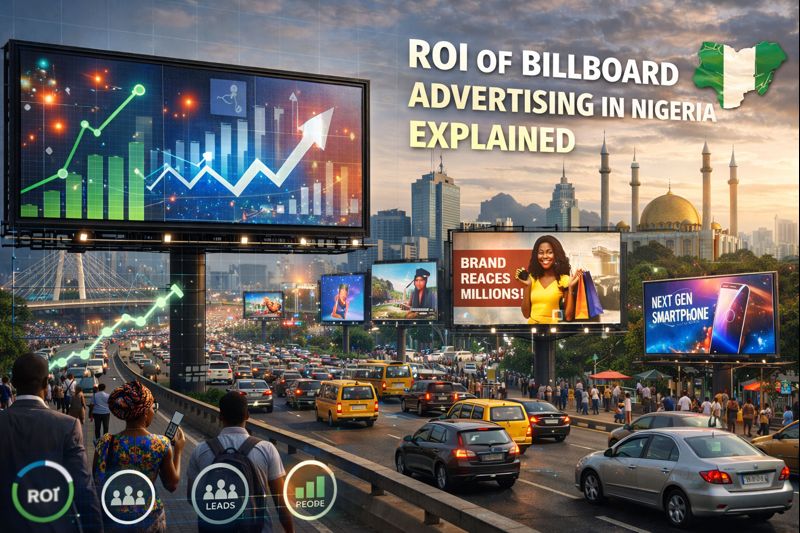
Outdoor advertising, especially billboards, has long been a staple of mass‑market marketing. In Nigeria, where urban traffic congestion is ubiquitous, commuters spend hours on the road daily, and visual exposure is constant, billboards remain one of the most impactful ways to reach large audiences consistently. But measuring impact and attention, not just potential reach, is essential for modern marketers‑in‑chief and performance analysts.
This guide explains the most important billboard metrics used to quantify traffic volume, audience attention, and real engagement, and how they work in Nigeria’s OOH (out‑of‑home) environment. You’ll learn how impressions are modeled, what dwell time means, how attention and engagement are measured, and which technologies are now redefining billboard analytics.
Why Billboard Metrics Matter Now More Than Ever
Billboard advertising in Nigeria isn’t just a brand‑awareness play. Because of structural factors unique to the country’s urban culture, long commutes, heavy congestion, and high OOH visibility, audience exposure is frequent, repeated, and often uninterrupted. GeoPoll reports that people spend around two hours a day outside their homes commuting, and static billboards rank among the most noticeable formats. Static board awareness was reported at over 80%, with 79% of respondents noticing a billboard in the past week and 63% always registering the message they saw.
Metrics have evolved from basic traffic counts to sophisticated analytics that help you quantify both physical exposure and cognitive attention. Today, marketers combine modeled impressions with dwell time, attention signals, and engagement data to understand real impact.
The primary reason this matters? Billboards are no longer a “brand‑feel” play. They’re part of data‑driven omnichannel measurement, and the better you can measure attention, the better you can justify spend, refine placement, and optimize creative.
1. Traffic Volume & Exposure Metrics
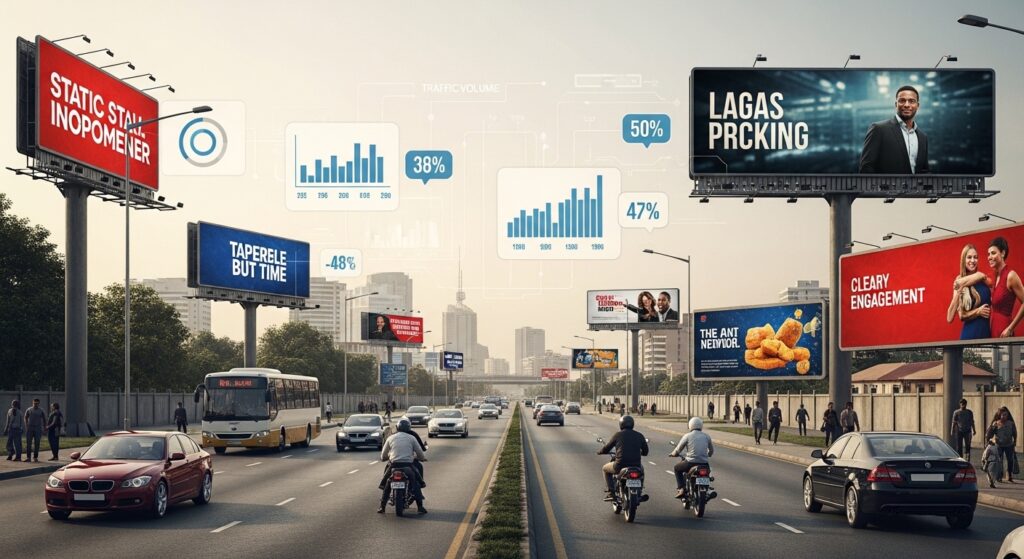
Traffic volume and exposure metrics estimate how many people pass a billboard and how often. These form the foundational numbers upon which all other attention analysis is built.
Daily Traffic Count (ADTC)
This is the basic “raw traffic” number, the total vehicles (and sometimes pedestrians) that pass a billboard location per day. In Nigeria, counts are often sourced from:
-
Local transport department statistics
-
Official traffic studies
-
GPS + mobility data aggregators
These raw counts are useful, but they don’t tell you how many individual human eyeballs actually see the ad.
Impressions (Modeled Visibility)
Impressions estimate how many times a billboard was likely seen during a campaign. They are modeled, not directly counted. The standard method for calculating impressions includes:
-
Daily Traffic Count
-
Vehicle occupancy estimates (often ~1.5 people per car)
-
Visibility adjustment factors, more on that below
For example, a prime location on Lagos’s Lekki‑Epe Expressway or Third Mainland Bridge might have a high ADTC, which translates into millions of potential impressions monthly when modeled.
Impressions are commonly used to compare OOH to digital metrics like “views”, even though they represent potential opportunities to be seen, not guaranteed viewing events.
Reach (Unique Audience Exposure)
Reach is the number of distinct individuals exposed to a billboard over a specific period. Because individuals can see the same board multiple times, reach quantifies unique exposures.
Even in densely trafficked Nigerian cities, reach helps distinguish between situations where one person sees a billboard 20 times versus 20 people seeing it once, and that distinction changes how exposure translates to recall rates and brand awareness.
Frequency (Repetitions Per Person)
Frequency measures how often the average person sees an ad during the campaign. OOH marketers often aim for a frequency between 7 and 10 opportunities to see per person to boost recall and message retention. Repeat exposures are critical for outdoor because first impressions build awareness and repeated impressions drive memory encoding.
Visibility Adjustment (Likely‑to‑See Factor)
Not every vehicle or pedestrian physically sees a billboard, and not every traffic count should be treated as a view. Visibility adjustment applies a percentage to raw traffic data based on:
-
Angle of the billboard
-
Distance from the road
-
Obstructions (tree lines, overlapping signs)
-
Traffic speed and visibility lines
This aligns with traditional models like Daily Effective Circulation (DEC), where raw counts are multiplied by a visibility index to produce realistic “effective impressions.”
2. Attention & Engagement Metrics
Measures like impressions and reach represent scale. But modern performance models demand measurements of attention and engagement, understanding not just how many saw an ad, but how long and how mindfully they received it.
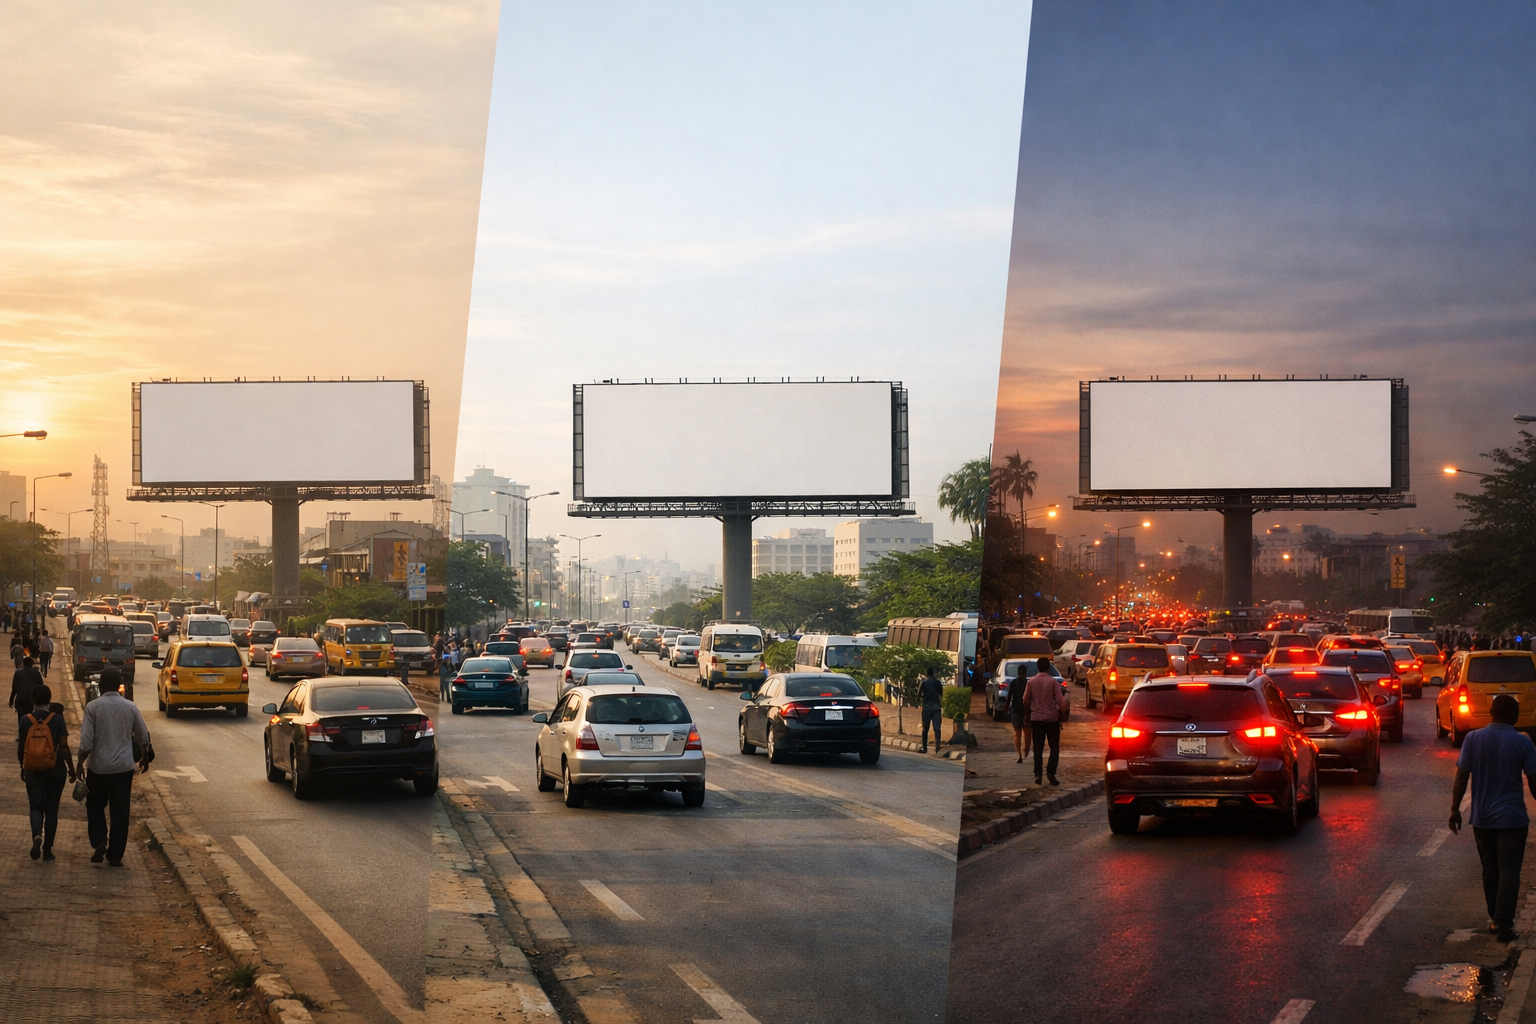
Dwell Time: Depth of Attention
Dwell time measures how long people remain within view of a billboard. Higher dwell time is associated with slower traffic, intersections, toll gates, and congestion zones, conditions common in Nigerian megacities like Lagos and Abuja. Extended dwell time increases the chance that viewers can:
-
Process the message
-
Recall the brand afterward
-
Act on a call to action (QR code, search term, etc.)
In practical terms, a board placed near a traffic light delivers significantly more dwell time than one on a high‑speed bypass, even if raw traffic counts are similar.
Attention Metric (OOH)
While impressions count potential opportunity to see, attention metrics measure whether an audience’s cognitive focus actually registered the billboard. Advanced methods, often involving eye tracking and computer vision in controlled studies, aim to estimate actual attention duration and depth.
These attention signals matter because OOH is inherently passive: unlike digital ads, billboards don’t require a click. Instead, brands increasingly rely on technology and modeling to infer engagement.
What is the “Three‑Second Rule” in Billboard advertising
A practical benchmark in OOH design assumes that the average commuter has roughly three seconds to absorb a billboard’s message before the vehicle moves out of sight. This rule influences:
-
Copy length
-
Font size
-
Visual hierarchy
-
Call‑to‑action simplicity
Billboards that violate the three‑second rule tend to have lower engagement, regardless of traffic volume.
Engagement Rate: Direct Interaction Signals
Modern campaigns can include direct tracking mechanisms:
-
QR code scans (0.5–2% typical scan rates)
-
Unique URLs entered after viewing
-
SMS shortcodes displayed on the billboard
These actions provide hard evidence that attention turned into interaction. When a viewer voluntarily engages with a billboard, that’s arguably stronger evidence of effective attention than modeled views alone.
Share of Voice (SOV)
This measures your billboard’s presence relative to competitors in a particular environment. A 100% SOV means no competing creatives share the visual field, a powerful position for dominance and recall.
Competitor proximity and creative clutter can dilute attention, so SOV is a critical planning metric.
3. How Modern Technologies Improve Measurement
As with digital media, OOH has benefited from new technologies that make formerly rough estimates far more precise.
GPS & Mobile Location Data
Aggregated, anonymized mobile data reveals real‑world movement patterns. It connects exposure with:
-
Foot traffic to physical locations
-
Subsequent digital behavior (searches, app visits)
-
Time spent near ad structures
This data is privacy‑compliant and highly valuable for live campaign measurement.
Eye Tracking & Facial Coding (Lab Studies)
While not part of every campaign, advanced experimental setups use eye tracking to measure:
-
Gaze patterns
-
Engagement duration
-
Emotional responses
These controlled insights help calibrate predictive models for real‑world attention.
Audience Measurement Platforms (e.g., Geopath)
Geopath is a global standard in OOH measurement. It uses:
-
Traffic counts
-
Demographic modeling
-
Visibility scoring
-
Audience estimation
Platforms like this provide standardized impression and frequency data for both planning and post‑campaign evaluation.
Mobile Attribution & Footfall Attribution
An emerging approach connects billboard exposure to later digital actions. For example:
-
People exposed to an outdoor ad may later search for the brand
-
Visit a store
-
Download an app
-
Engage with the brand online
This mobile data fusion extends OOH’s impact far beyond physical impressions.
4. A Closer Look at Performance Indicators
Below is a concise summary of key performance indicators widely used in billboard performance measurement:
| Metric | Purpose | Typical Source |
|---|---|---|
| Impressions | Total potential exposures | Traffic models, mobility data |
| Reach | Unique viewers over time | Traffic models, frequency analysis |
| Frequency | Average exposures per person | Traffic + demographic models |
| CPM | Cost efficiency per 1,000 views | Cost / Impressions |
| Dwell Time | Attention duration | GPS/Mobile data, modeling |
| Engagement | Direct interactions | QR/URL/phone tracking |
| Brand Lift | Recall & awareness | Surveys & mobile data |
| Share of Voice | Competitive dominance | Creative placement analysis |
This framework allows advertisers to compare billboard performance against other channels and refine media mix strategies.
6. Strategic Planning With Metrics in Mind
Understanding metrics is foundational, using them strategically is what drives campaign success.
Plan Based on Traffic Patterns
Prioritize billboard locations with:
-
High ADTC
-
Congested commuter windows
-
Slow daily peak periods
-
Proximity to retail or purchase points
Calculate Frequency Targets
Campaigns with one‑off exposure tend to underperform. Aim for multiple views (7–10) over the campaign period, which strengthens recall.
Leverage Direct Engagement Tactics
Embedding QR codes or unique URLs transforms passive exposure into trackable interactions. This expands measurement beyond impressions to actual engagement.
Integrate OOH With Digital Channels
Outdoor exposure often drives digital activities such as searches and social engagement. Use multi‑touch attribution to connect OOH with online performance.
Use Attention Metrics to Refine Creative
Billboards designed with clear hierarchy, minimal text, and visual cues aligned with the three‑second rule deliver stronger attention metrics.
7. The Future of Billboard Metrics
Outdoor advertising measurement is no longer limited to estimates. Modern platforms and data sources are pushing OOH into the realm of performance marketing. Anonymized mobility data, footfall attribution, mobile engagement signals, and cross‑channel analytics are enabling OOH spend to be justified with real KPIs, not assumptions.
With programmatic DOOH and audience targeting models emerging, real‑time performance optimization will only get stronger.
Conclusion:
Billboard advertising in Nigeria is a blend of reach and attention. Traditional traffic counts provide the “what, how many had the opportunity to see” while attention metrics and engagement measures answer the “how much and how meaningfully they saw it.”
By combining these layers into a structured measurement framework, marketers can:
-
Assess the true scale of exposure
-
Understand viewer attention quality
-
Connect billboard exposure to actual engagement
-
Justify spending with real business impact
Packed with data sources, modeling methods, and modern measurement tools, this approach turns what was once a black box into a measurable, accountable media channel.